Graphy envisions a world where data is not just collected but clearly communicated, transforming decision-making from a guessing game into a precise, insightful journey. We are dedicated to democratizing data storytelling so that anyone, regardless of technical skill, can unlock the power of their data through vivid, AI-driven visual narratives.
Our mission is to recalibrate how teams interact with data by embedding intelligent automation that interprets raw figures and crafts the clearest, most impactful charts. By removing the noise and complexity typical of data presentation, Graphy aims to foster deeper understanding and swifter, more confident decisions across organizations.
Driven by innovative AI technology and a commitment to simplicity, we are building a future where data insights are effortlessly accessible, enabling stronger alignment and more actionable outcomes for teams worldwide.
Our Review
We've been watching the AI data visualization space closely, and Graphy caught our attention for doing something genuinely useful: turning messy spreadsheets into clear, actionable insights without the usual headaches. In a world drowning in data, that's no small feat.
What Makes It Click
The magic here isn't just in making pretty charts—it's in the AI's ability to actually understand your data and surface the insights that matter. You upload a CSV or connect your Google Sheets, and Graphy doesn't just generate graphs; it tells you what the data is saying with headline takeaways that cut through the noise.
We particularly appreciate how the platform eliminates the back-and-forth that usually plagues data discussions. Instead of spending half your meeting explaining what the numbers mean, you walk in with clear visuals and AI-generated insights that everyone can actually understand.
The No-Prep Promise
Here's what impressed us most: Graphy works with raw, unprepared data. Anyone who's spent hours cleaning spreadsheets before making a single chart knows this is a game-changer. The AI handles the heavy lifting of figuring out what visualization works best for your specific dataset.
The platform's focus on trustworthiness and clarity shows in the output—these aren't just flashy graphics but charts designed to communicate real insights quickly and accurately.
Who Should Pay Attention
This tool shines brightest for business managers, analysts, and team leads who need to communicate data insights regularly but don't want to become Excel wizards. If you're tired of wrestling with chart formatting or explaining the same data trends over and over, Graphy's approach to automated storytelling could save you serious time.
With an estimated $9.7 million in revenue and a San Francisco base, Graphy appears to be gaining solid traction in the competitive data visualization market—and frankly, we can see why.
Features
Upload or connect live data sources like Google Sheets and CSVs
AI analyzes data and generates charts with insights
Customization of charts on request
Focus on clarity, trustworthiness, and actionable results
FAQs
Ploy was founded in 2024.
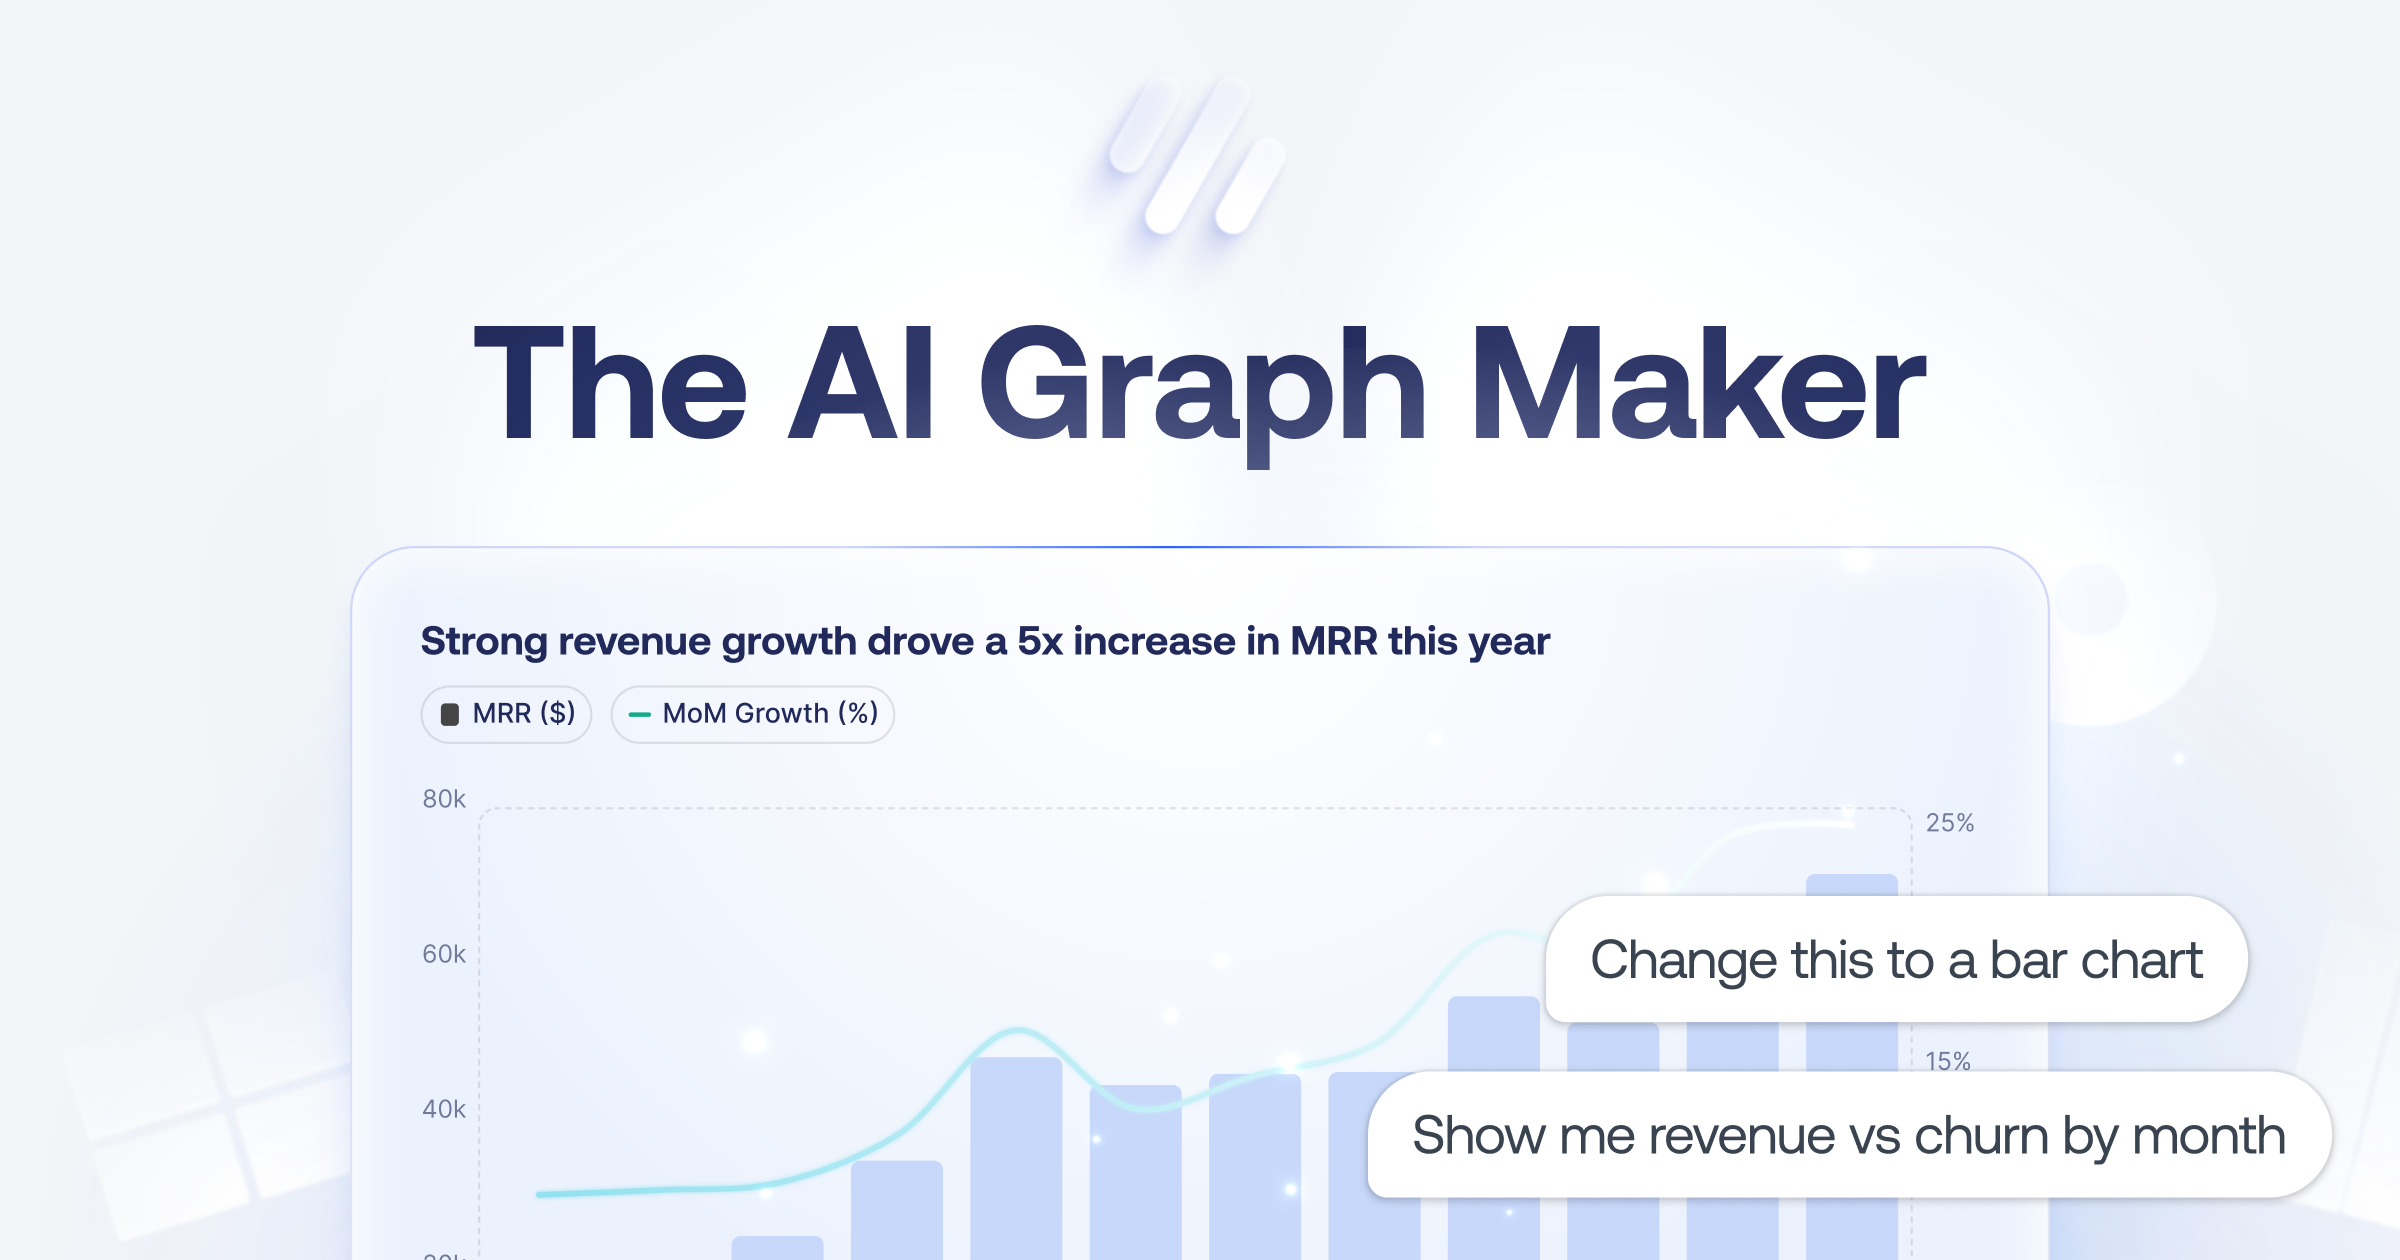

Graphy is the charting infrastructure for AI-native products. We provide a complete SDK and agentic API for building editable, story-driven data experiences inside your product. Beautiful charts, plug-and-play editor, AI-powered generation, all designed to feel native in your product. Already used by 500k+ users, powering charting for some of the fastest-growing AI companies like Gamma, who switched to the SDK and Agents after trying to build charts in-house for 2+ years. Backed by Coatue, General Catalyst, Northzone, Seedcamp, Tiny, Weekend Fund and others.



Qualified Health


Relume


Blaze



Dreamhub


ING